
STEALTH QE
The Fed claims to be tightening conditions within the financial system. However, all liquidity indicators are surging- could they have created a backdoor QE?


After financial chaos brought on by COVID-19, the Federal Reserve had responded with record liquidity injections. For almost 2 years, they printed $120B a month, buying Treasuries and Agency Securities, until the fall of 2021 when the Taper began. At first, this wasn’t a “true taper”- they were only decreasing the rate at which they were buying new securities.
Starting in November, the central bank initiated tapering, decreasing its total monthly purchases from $120 billion to $105 billion, a reduction of $15 billion. On December 15th, the Fed opted to accelerate this process, and started to cut purchases by $30 billion monthly. At this accelerated pace, the Fed was projected to cease purchasing new assets by spring 2022.
And that’s exactly what happened. The Fed’s assets peaked on April 13th and then began a slow and steady decline. This continued until the regional banks began blowing up in March 2024, and the Fed quickly opened up more liquidity floodgates to save the system.

Shortly after, the Fed ostensibly resumed their taper and the balance sheet began falling again. Financial markets, however, didn’t respond to this in their usual manner, instead rallying throughout the year and into 2024. This perplexed more simplistically minded analysts, who did not understand that the toolkit that the monetary authorities have at their disposal is expanding.
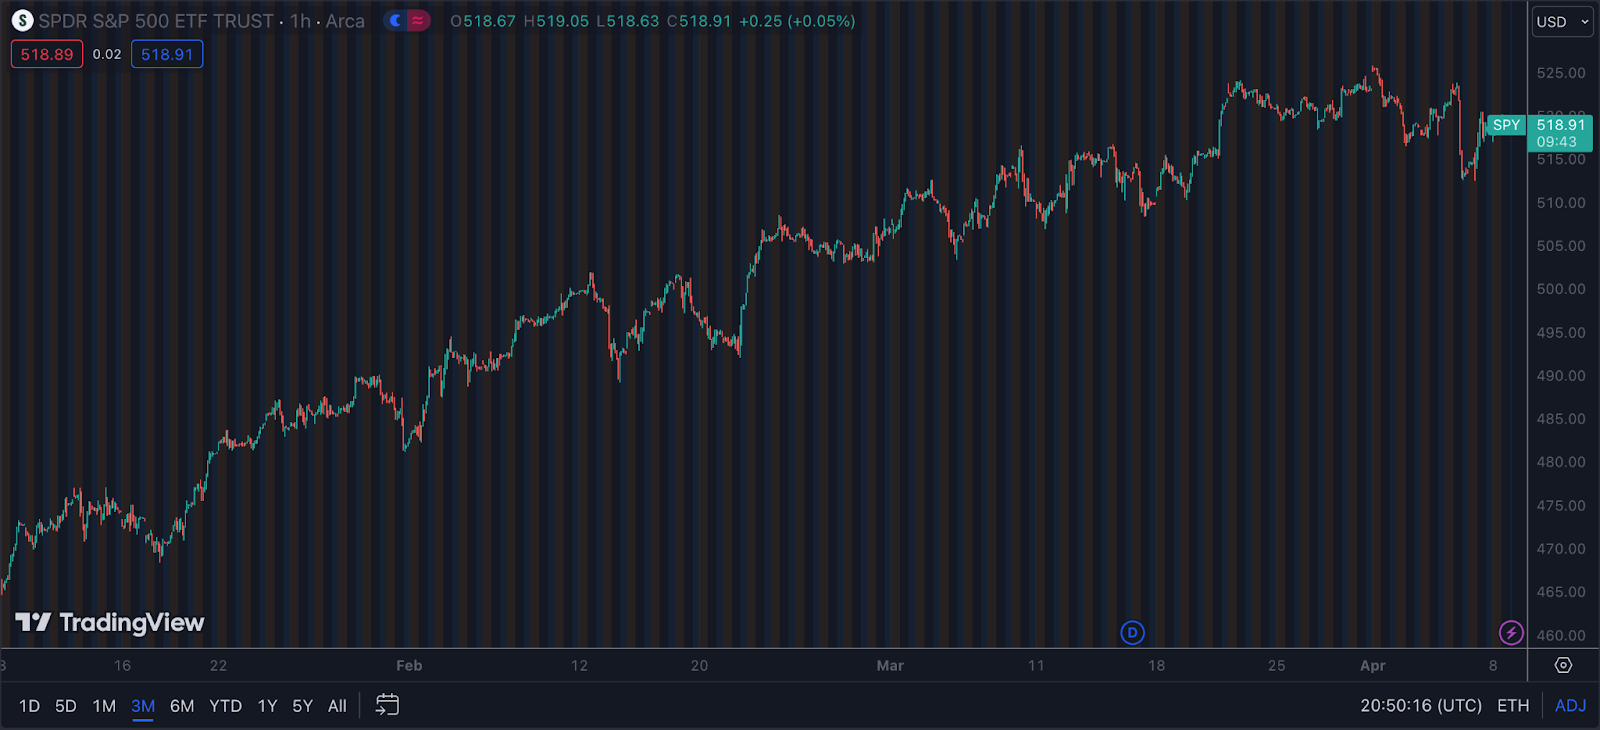
By the way, this chart looks awfully familiar for those who watched the tidal wave of QE walk markets up during 2021.
As I’ve touched on in depth in several substack posts, including one called Net Liquidity, the current market understanding of what constitutes liquidity has expanded. The original view was that the Fed’s balance sheet, and the level of bank reserves, were the only material additives to cash reserves, and thus were significant in terms of determining market direction. However, this view proved to be incorrect, and as I laid out in that piece, several new Fed and Treasury facilities have created new sources of fresh cash to the banking system.
Fed Net liquidity is graphed here. As you can see it bottomed in late 2022.
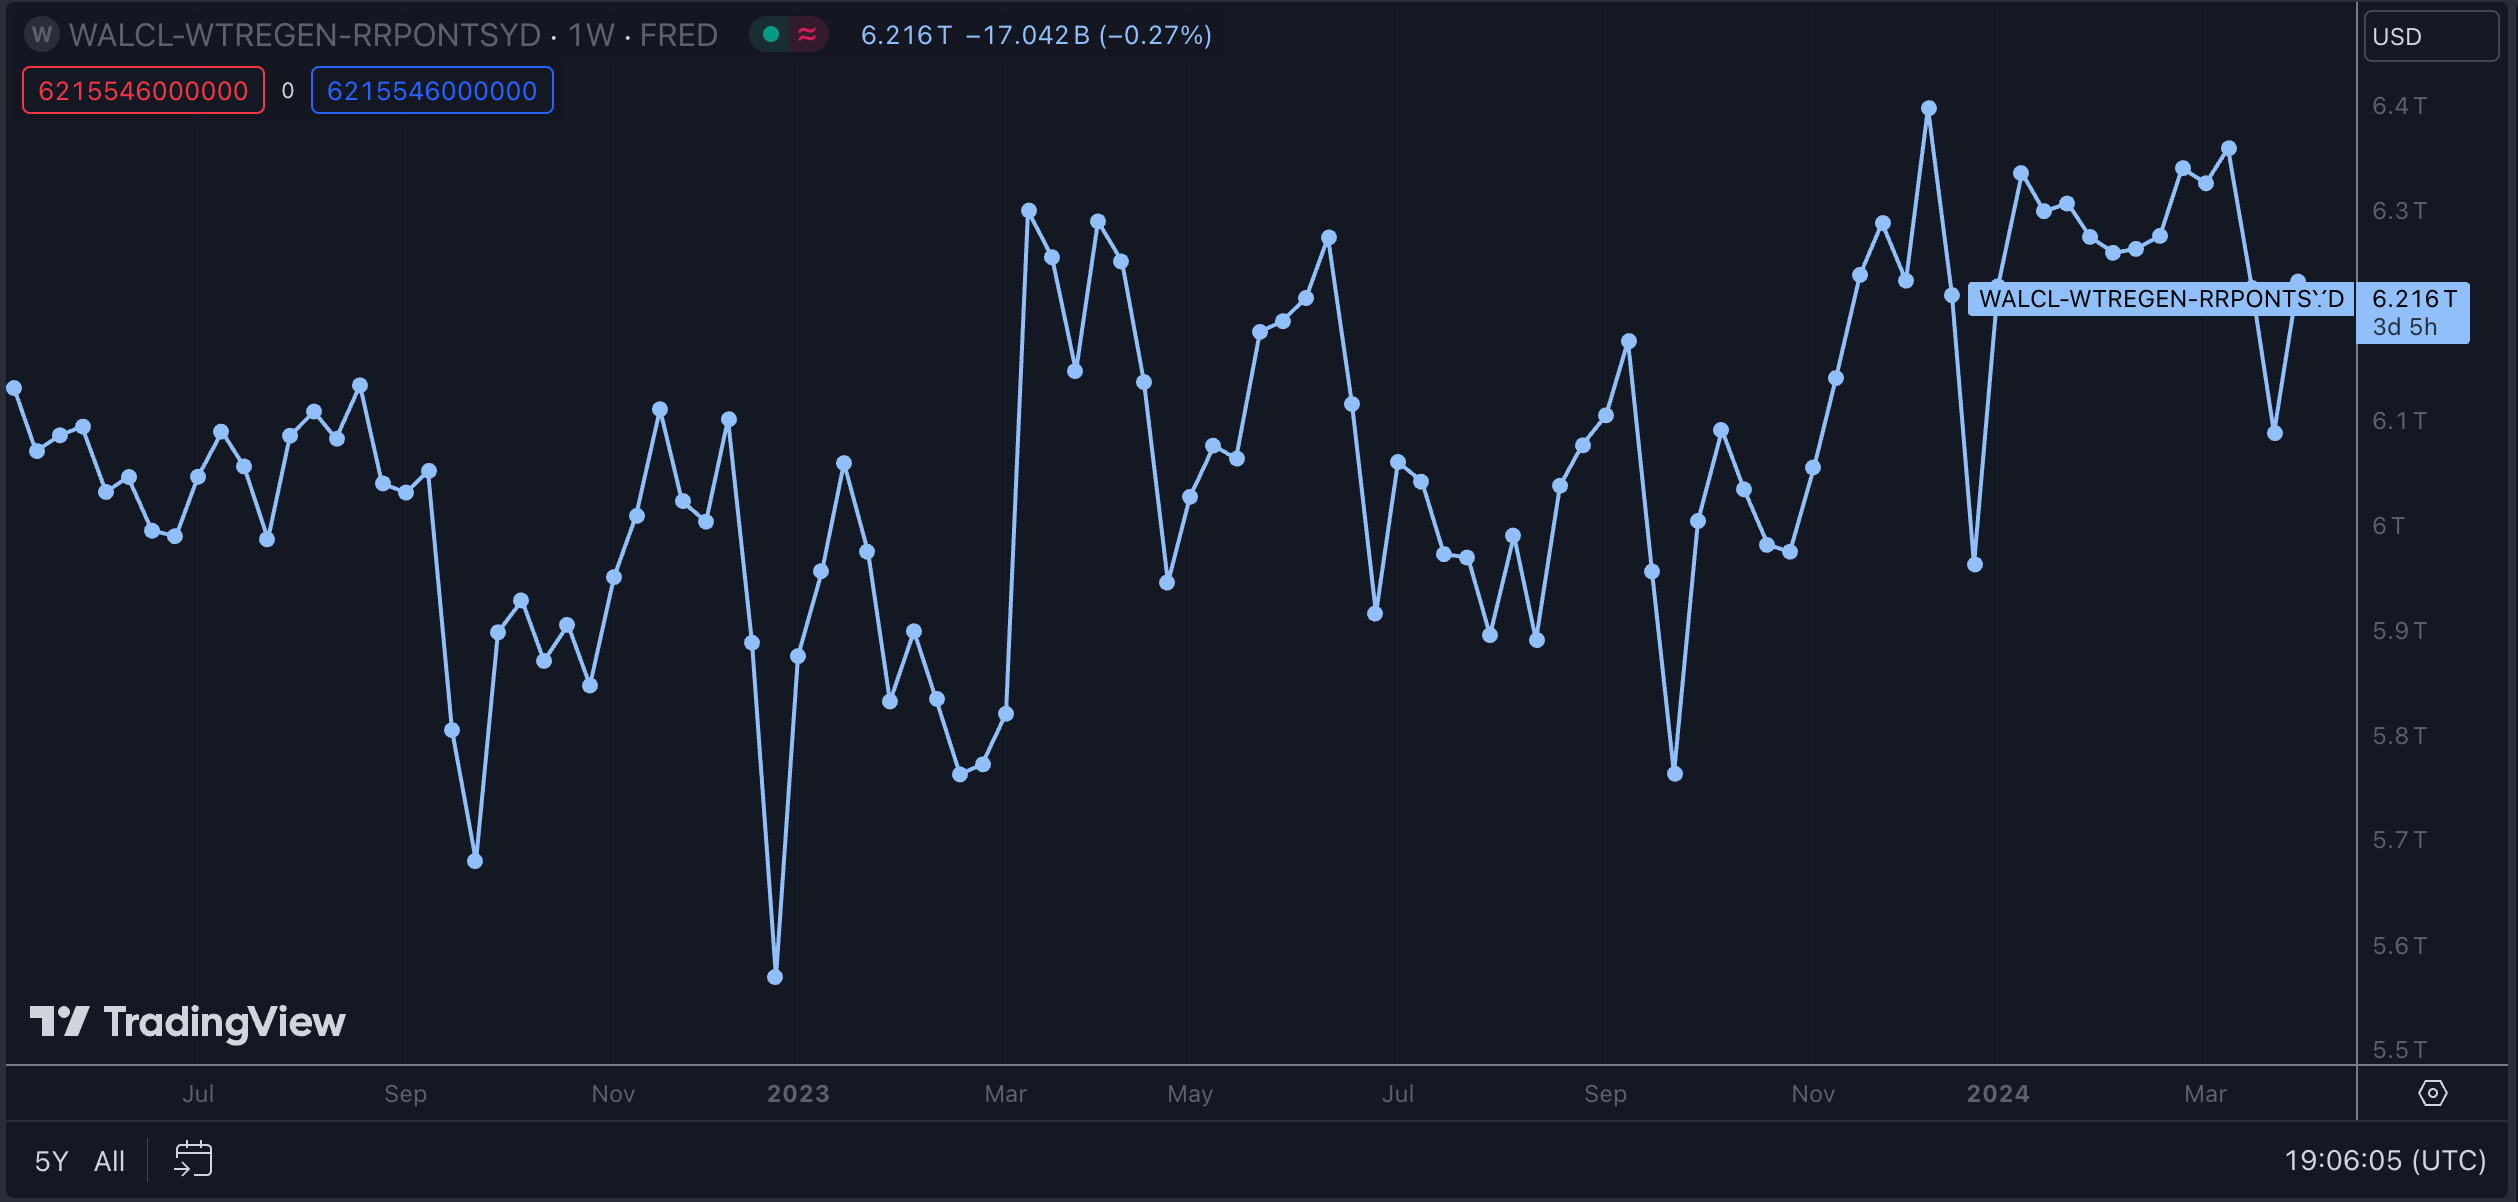
Recent events have proven that the tools at the disposal of the authorities are expanding even further, along with their capacity to hide the liquidity injections. The Net Liquidity thesis is now being updated.
