
The Fourth Winter
Bitcoin’s bear markets keep getting shallower. But its bull markets keep getting smaller.


In the last week of June, Bitcoin did something it hadn’t done since 2023: it closed a full week below its 200-week moving average. This was below the line that has functioned as the floor of every bull market since the exchange first started trading.
Bitcoin opened July at $57,950, the lowest print in 652 days, and the Crypto Fear and Greed Index cratered to 11, deep in what the index calls extreme fear. As of this writing BTC is changing hands around $62,000, down roughly 51% from the $126,198 all-time high printed on October 6, 2025.
Extreme fear readings, a record month of ETF outflows, and the largest corporate Bitcoin treasury on earth quietly breaking its own “never sell” pledge all happened within about six weeks of each other.
If you’ve been through this before, none of that should surprise you. What’s actually interesting isn’t that the drawdown happened, it’s the shape of it relative to the three that came before it.
Every single Bitcoin bear market in the asset’s history has been shallower than the one before it, and every bull market has delivered a smaller multiple than the one before it, and both trends are still fully intact in this cycle.
Let’s dig in.
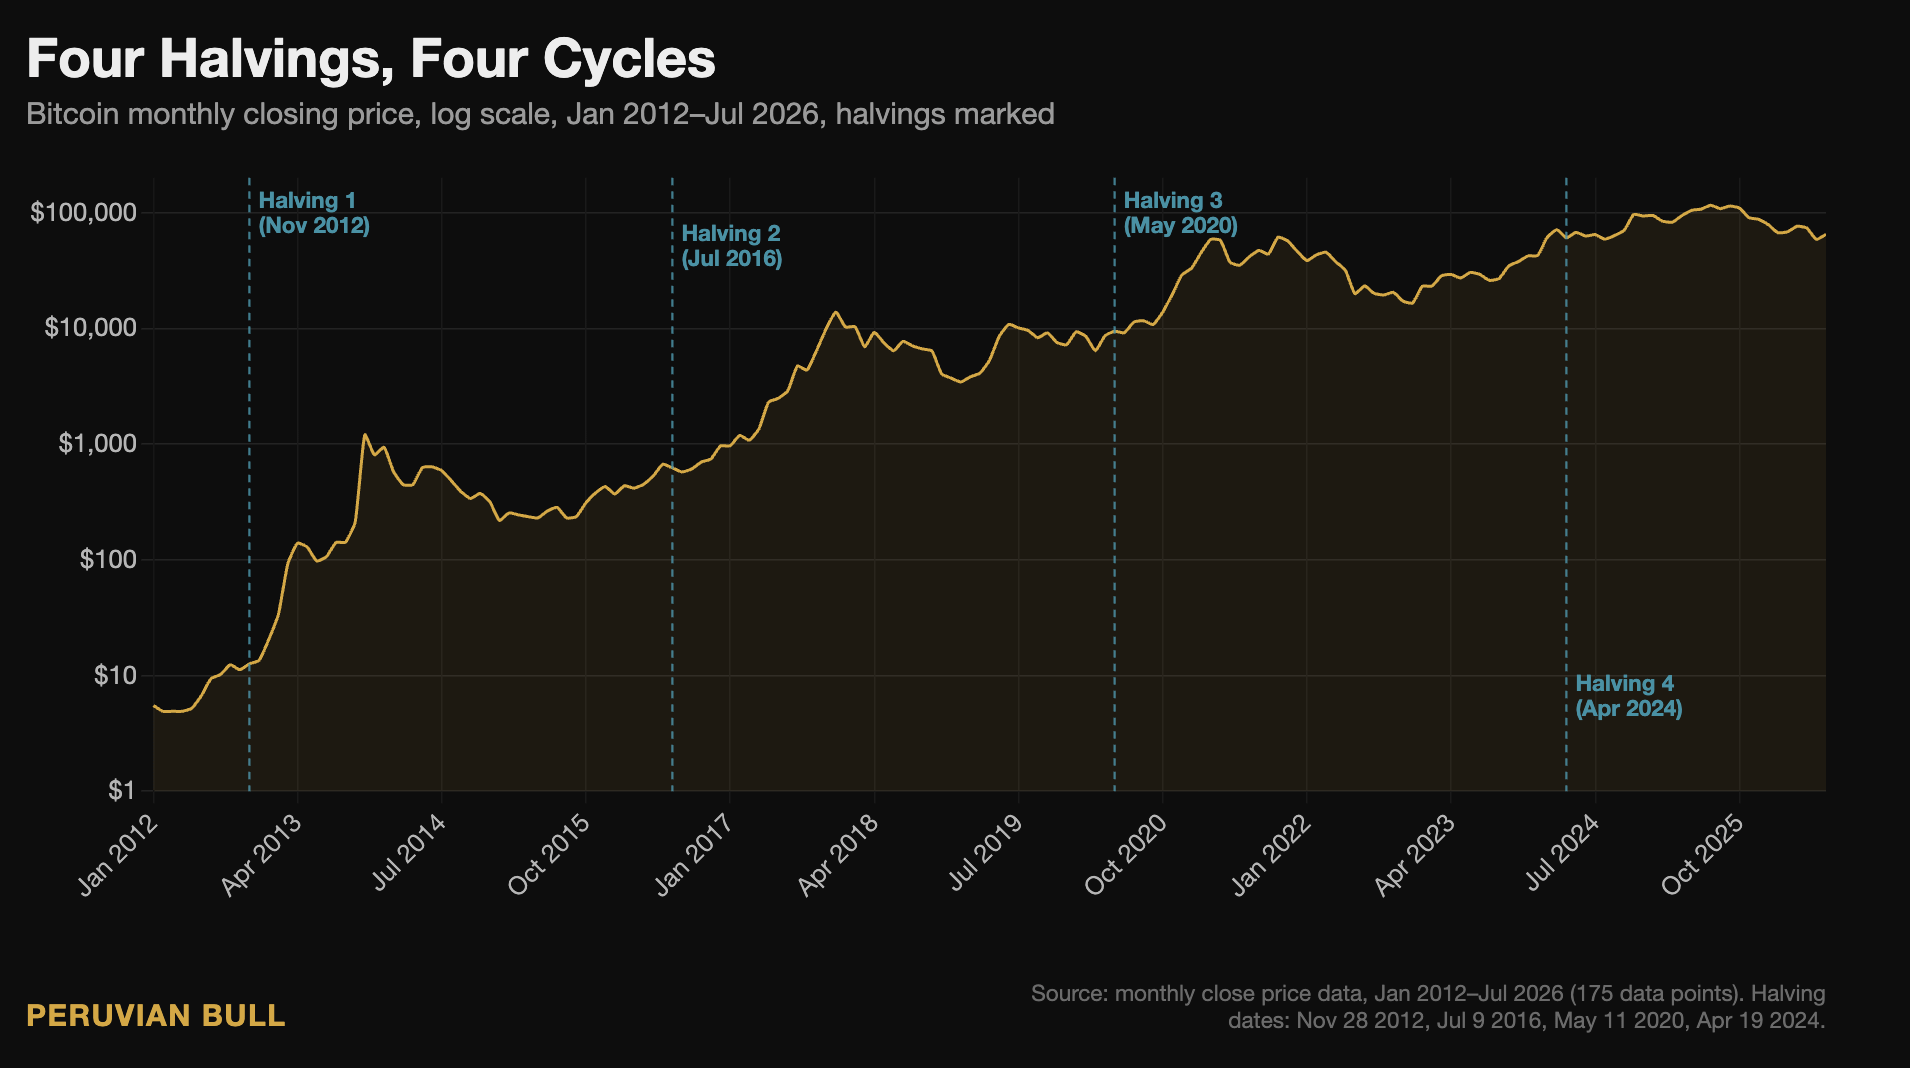
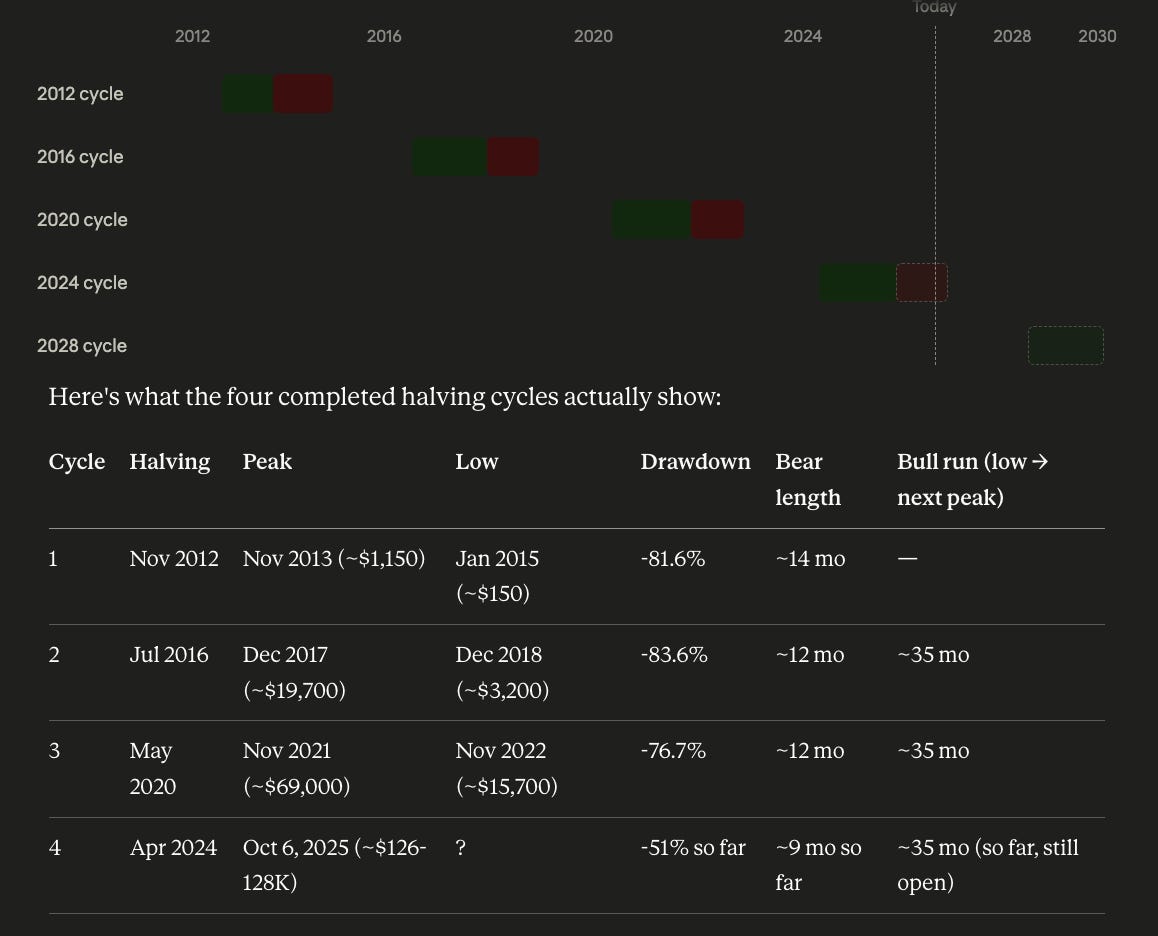
Bitcoin has now completed four halvings: November 28, 2012; July 9, 2016; May 11, 2020; and April 19, 2024. Each one cuts new supply in half, and each one has been followed, with a six-to-eighteen-month lag, by a blow-off top and then a brutal correction.
Four cycles is a small sample, but it’s the only one we’ve got, and it’s remarkably consistent:
The 2013 top hit $1,127, then bled out to a $152 bottom in January 2015, an 86% drawdown. The 2017 top hit $19,665, then collapsed to $3,122 the following December, an 84% drawdown. The 2021 top hit $69,044, then FTX dragged it to $15,460 by late November 2022, a 78% drawdown.
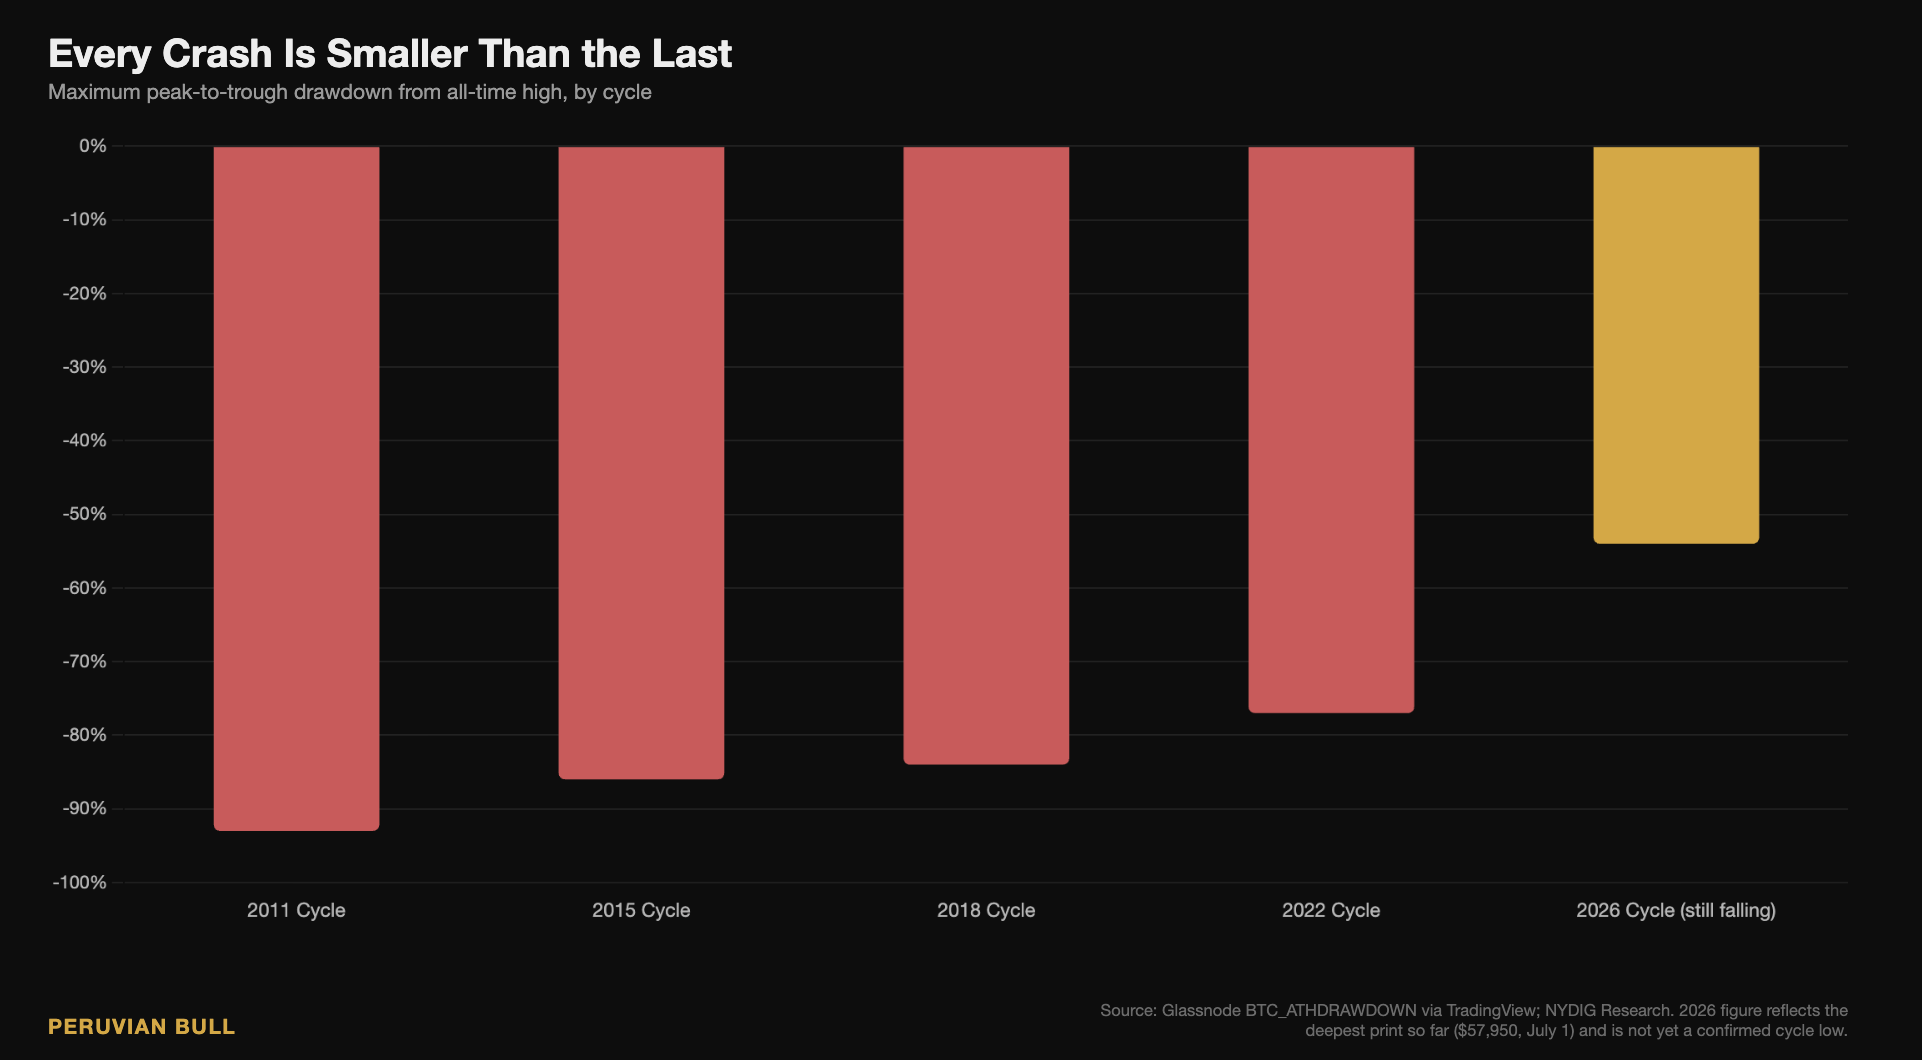
This cycle’s top, $126,198 on October 6, 2025, has so far produced a maximum drawdown of roughly 54%, with the low print at $57,950.
Go back one more cycle and the pattern holds further: the 2011 top drew down 93% before finding a floor.
Ninety-three, then eighty-six, then eighty-four, then seventy-eight, and now fifty-four and probably still falling: a market getting structurally less violent every cycle, because the asset is bigger, more institutionally held, and requires more capital to move the same percentage.
Look at that trendline and you’ll notice something uncomfortable: 54% is nowhere near where it says this cycle “should” bottom. If the slope from 93 to 86 to 84 to 78 continues, the next number lands in the high sixties to low seventies, not the mid fifties. KuCoin’s news desk ran the same extrapolation and arrived at a 60% to 70% terminal decline, putting the bottom between the high-$30,000s and low-$50,000s off the $126,000 peak. Mechanically, if history holds, there’s more room below $57,950 before this is over.
And here’s the problem that most bitcoiners won’t admit: the upside has been compressing at least as fast as the downside has been softening.
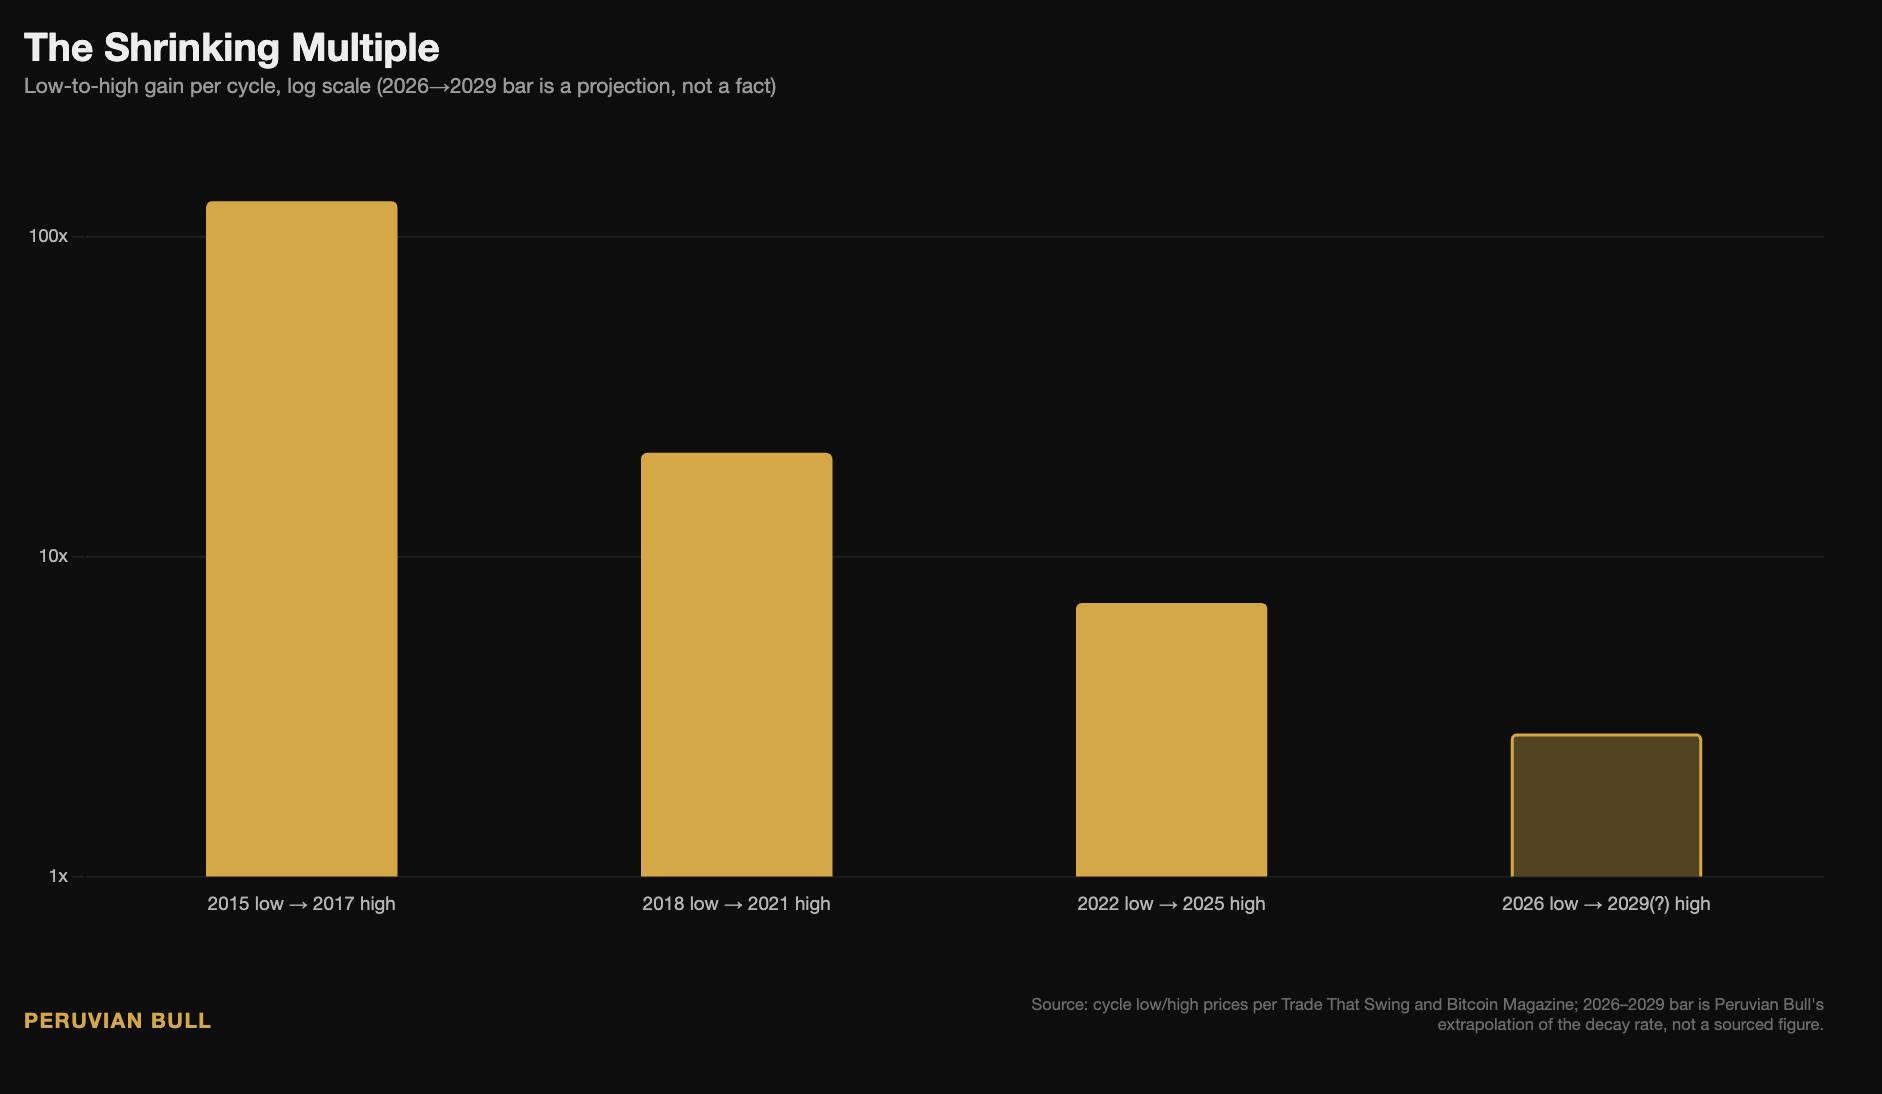
From the January 2015 low of $152 to the December 2017 top of $19,665, Bitcoin returned roughly 129x, a 12,804% rally.
From the December 2018 low of $3,122 to the November 2021 top of $69,044, the return was roughly 21x, broadly in line with Bitcoin Magazine’s figure of “more than 2,000%” for that cycle.
From the November 2022 low of $15,460 to the October 2025 top of $126,198, the return compressed again to roughly 7.16x, a 716% gain.
Bitcoin Magazine ran the same math using the Golden Ratio Multiplier, which measures cycle tops against Fibonacci bands of the 350-day moving average, and found the same decay: the 2013 top tagged the 21x band, 2017 tagged 5x, 2021 tagged 3x, and this cycle only reached the 2x and 1.6x bands before rolling over.
129x, then 21x, then 7.16x.
That’s a market maturing in real time: the crashes get gentler, and the moonshots get smaller.
Anyone still mentally pricing in a repeat of 2017’s 129x off this cycle’s low is not reading the trend, they’re reading their own nostalgia. If the compression ratio holds even loosely, each cycle’s multiple running at roughly a fifth to a third of the one before it, the next cycle’s low-to-high gain lands somewhere in the 2.5x to 3.5x range.
That’s still an extraordinary return by any conventional asset class standard. It’s not the kind of number that turns a five-figure portfolio into a beach house in eighteen months, and it’s the same maturation curve every asset class walks as its market cap scales.
If the top-down cycle math says there’s more room to fall, the bottom-up on-chain data agrees. The MVRV Z-Score measures how far Bitcoin’s market value sits above or below its “realized value,” the aggregate cost basis of every coin on the network.
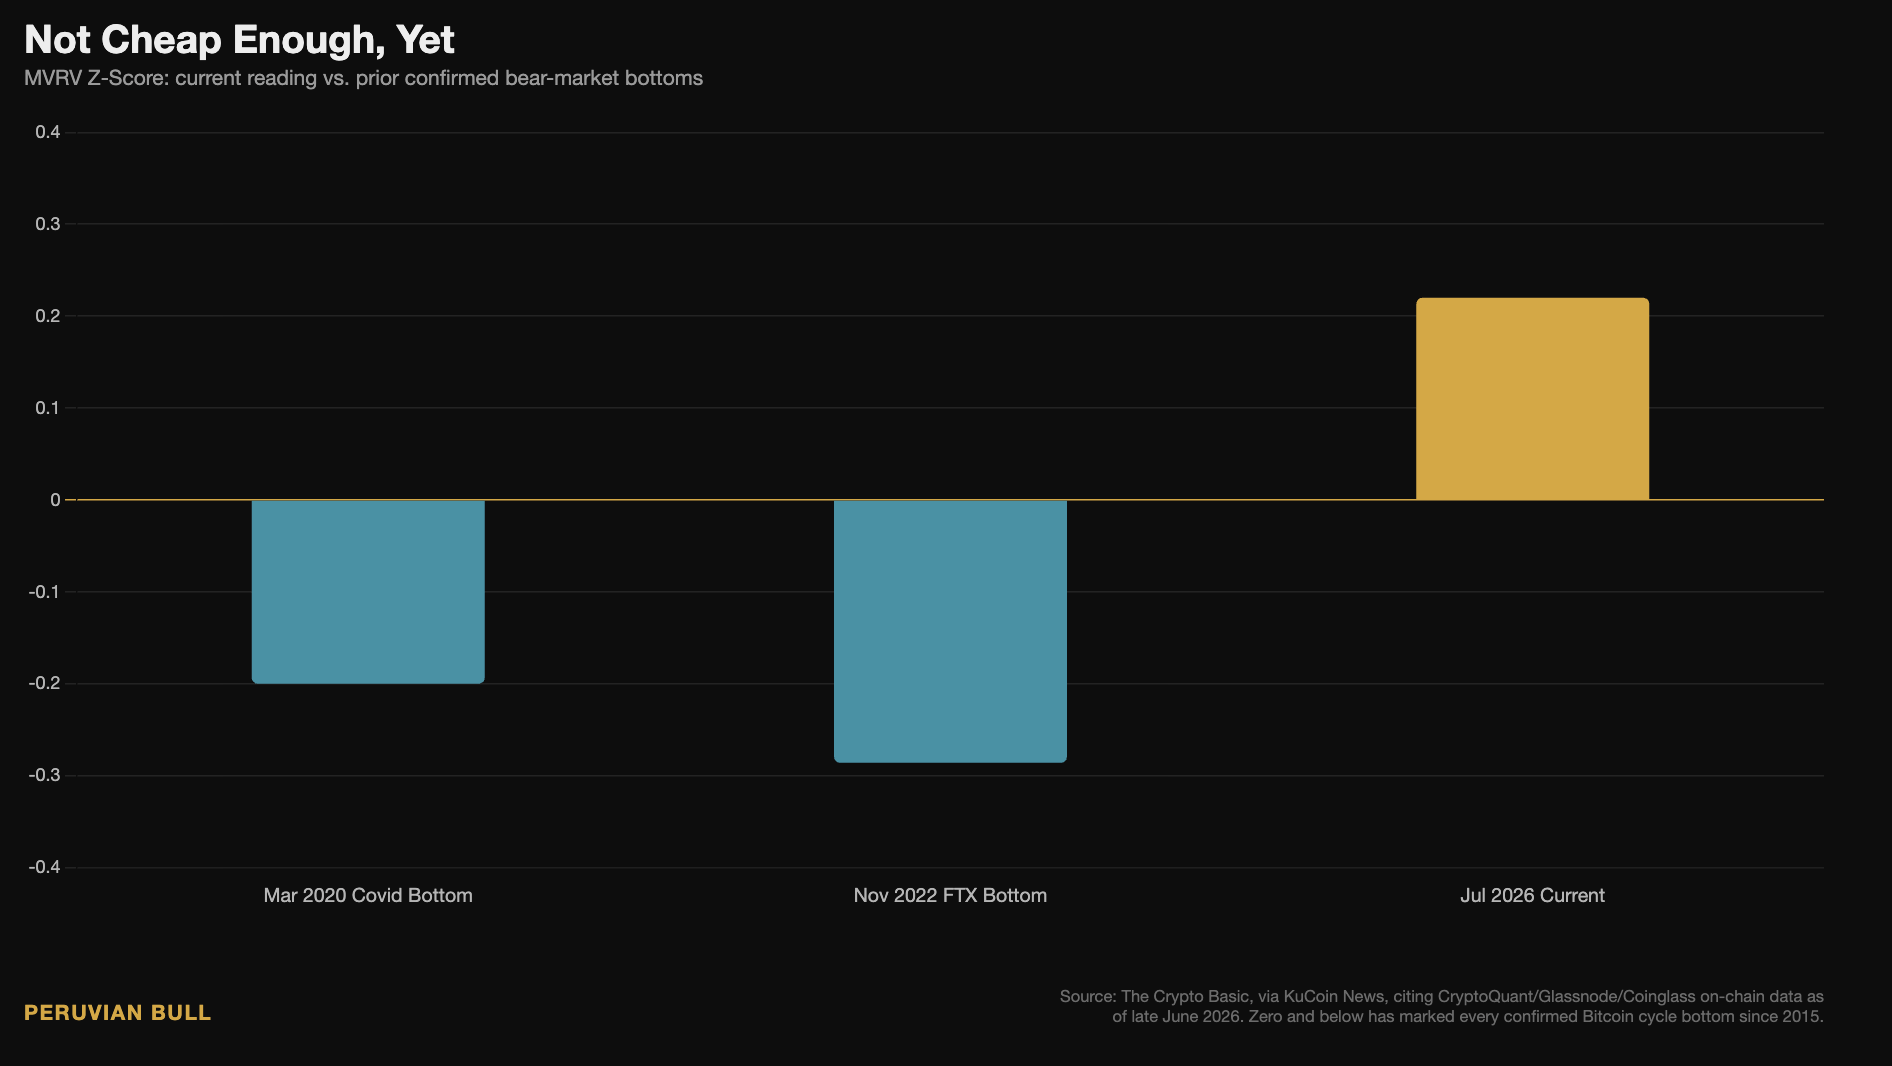
Every confirmed cycle bottom since 2015 has coincided with this metric dropping to zero or below. At the March 2020 Covid low, it bottomed at -0.20. At the November 2022 FTX low, it bottomed at -0.286. As of late June 2026, the reading was 0.22: positive, nowhere near the green zone that has marked every bottom on record.
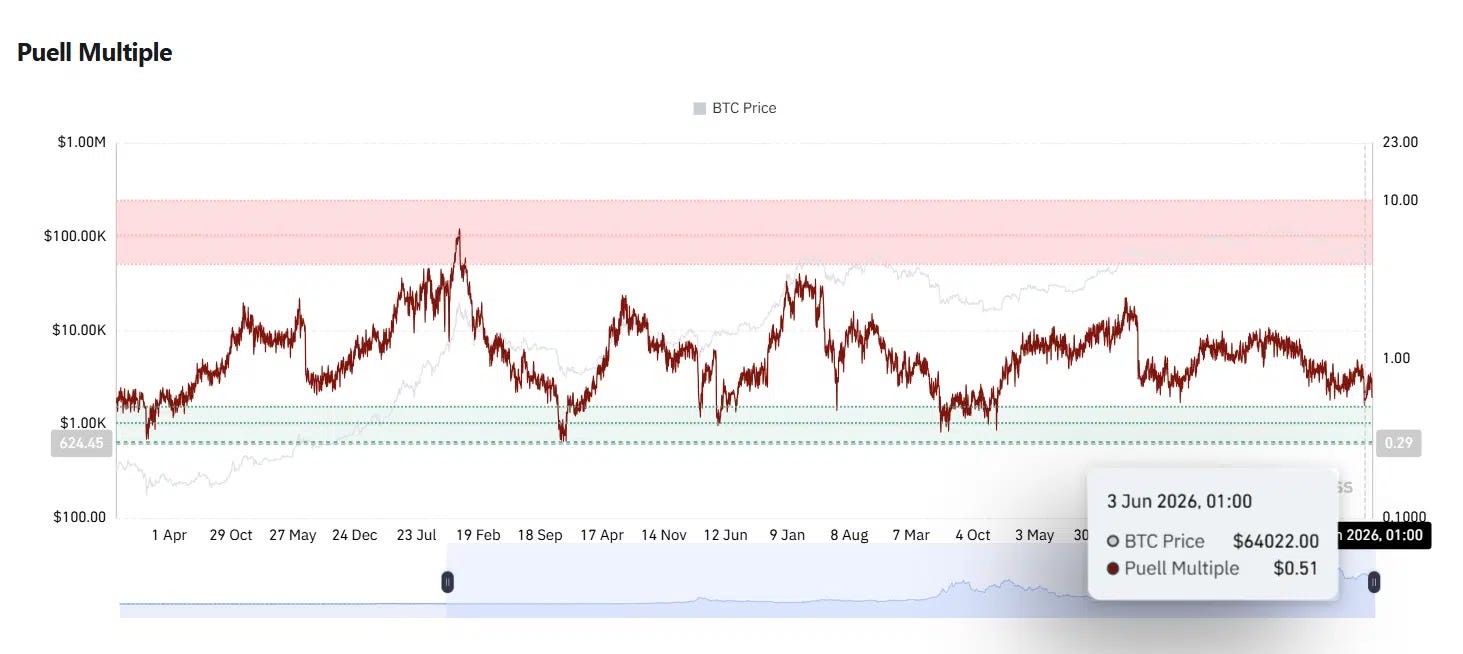
The Puell Multiple, which tracks miner profitability, tells the same story: it printed 0.51 on June 3, still above the sub-0.5 readings that have historically marked capitulation.
NUPL fell to 0.19 in late February and stayed around 0.18 to 0.19 through the June selloff, but never crossed negative the way it did at the November 2022 low. Most persuasive of all: short-term holder MVRV sat at 0.84 while long-term holder MVRV remained at 1.29 in early June. Every prior cycle low required those two lines to converge. That hasn’t happened yet.
PlanB made essentially this same point on July 1, noting Bitcoin closed June at $58,526, below its 200-week moving average of roughly $62,000, but above its realized price of $52,000, flagging that “all previous bear market bottoms were below realized price.” The uncomfortable read across four independent on-chain metrics, all pointing the same direction, is that this bear market probably isn’t finished, no matter how bad the last six weeks have felt.
Research firm K33 flagged in mid-June that long-term holders control a record 79% of circulating supply, that old-coin reactivation is near a historic low, and that roughly half of circulating supply sat underwater, a threshold they noted has historically shown up within weeks of a bottom. K33 also flagged that ETF outflows had eased. That aged badly fast: they accelerated into the worst month on record two weeks later.
Wintermute, Glassnode, and Bitfinex have all separately warned that flows and institutional demand haven’t reached levels consistent with a durable reversal, with some forecasts running as low as $30,000. Long-term holders refusing to sell is a real, bullish signal. It hasn’t been enough yet.
None of this is happening in a vacuum, and if you’ve read Net Liquidity or anything else I’ve written on this Substack, you know I don’t think you can analyze Bitcoin separately from the plumbing of the dollar system it trades inside of.
Kevin Warsh was confirmed as Fed Chair on May 13, 2026, in a 54-45 vote, the closest confirmation margin in the central bank’s modern history, and he’s on paper the most crypto-friendly person to ever hold the job, having called Bitcoin “the new gold” for investors under 40. And yet Bitcoin fell the weekend he took office and has kept sliding since. The market isn’t pricing Warsh’s opinion of Bitcoin. It’s pricing his effect on liquidity, and on liquidity he is, for now, a headwind, not a tailwind.
At his first FOMC meeting on June 17, Warsh launched five task forces to review Fed operations, held rates steady at 3.50% to 3.75%, and by early July the balance sheet sat at $6.725 trillion, still triple its pre-2008 size. In Congressional testimony on July 14 he promised markets “good advance notice” before any balance sheet moves, and said flatly that the government would not bail out anyone, crypto included.
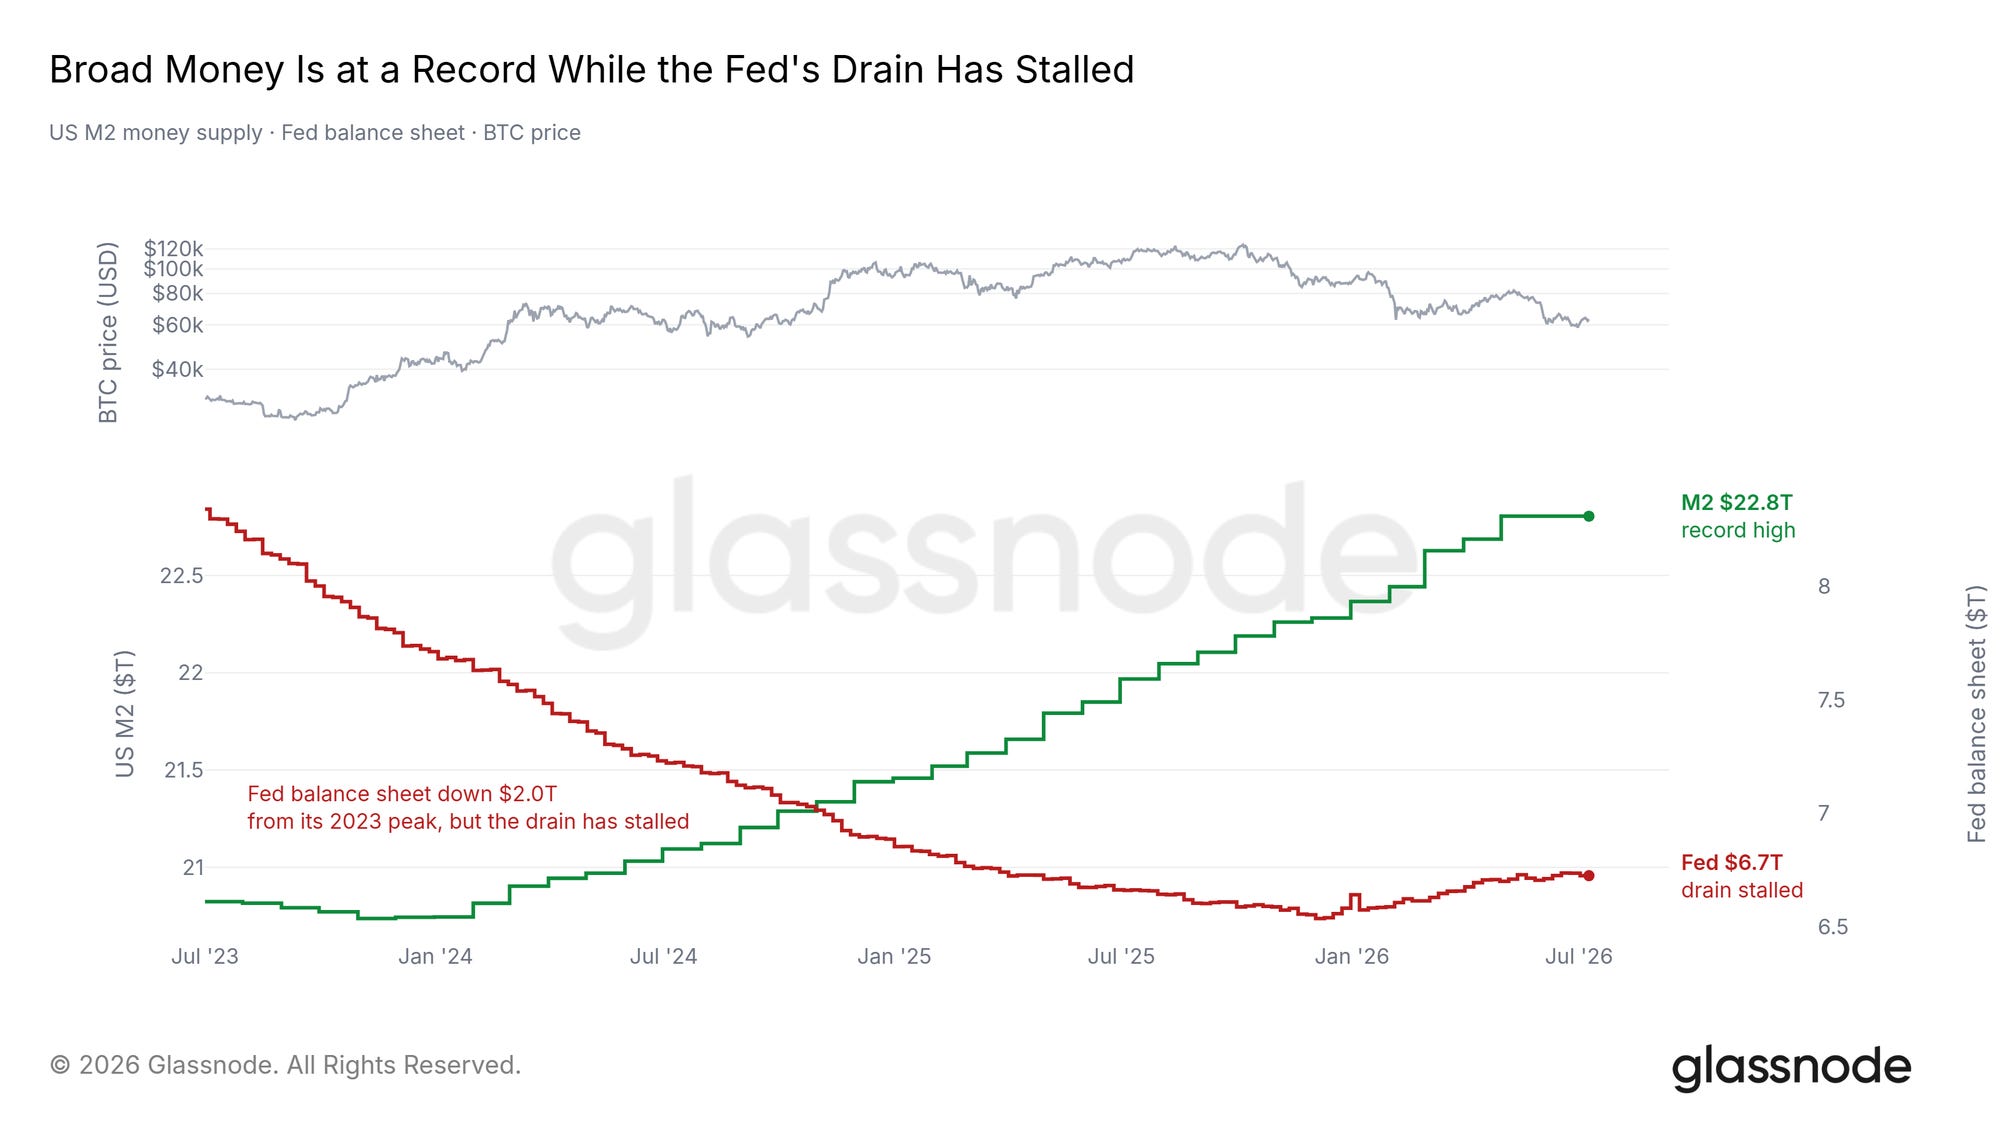
The Fed balance sheet has fallen a record $2 trillion from the highs, but at the same time M2 growth is still chugging along- it hit a new record high of $22.8T this month.
The optimistic case hinges on the “QT-for-cuts” thesis, the argument that AI-driven productivity gains let the economy grow without reigniting inflation, which would give Warsh room to cut rates while still shrinking the balance sheet.
If it plays out, some analysts see Bitcoin back near and above $95,000 on the liquidity unlock alone. If it doesn’t, this squeeze continues: markets were pricing a 62% probability of zero rate cuts for 2026 when Warsh took office, a figure that’s since climbed toward 69%.
If this cycle has a 2022-style FTX moment still coming, the most likely trigger isn’t sitting on an exchange, it’s sitting on Strategy’s balance sheet.
For four years, Michael Saylor’s “never sell” pledge was the closest thing crypto had to a religious commitment.
On June 1, that ended: Strategy sold 32 Bitcoin to help cover preferred dividends, tiny in size, enormous in symbolism, followed by 3,588 BTC across two transactions in the week ending July 5.

The company holds roughly 843,775 BTC at an average cost basis of $75,476 per coin, worth about $53.8 billion, against total obligations that now exceed that value. Its enterprise mNAV, the ratio of the company’s full economic value to its Bitcoin holdings, closed below 1.0 for the first time on record, and using market rather than face value for its debt and preferreds, the real figure was closer to 0.89. The company booked an $8.32 billion unrealized loss on its Bitcoin holdings in Q2 alone.
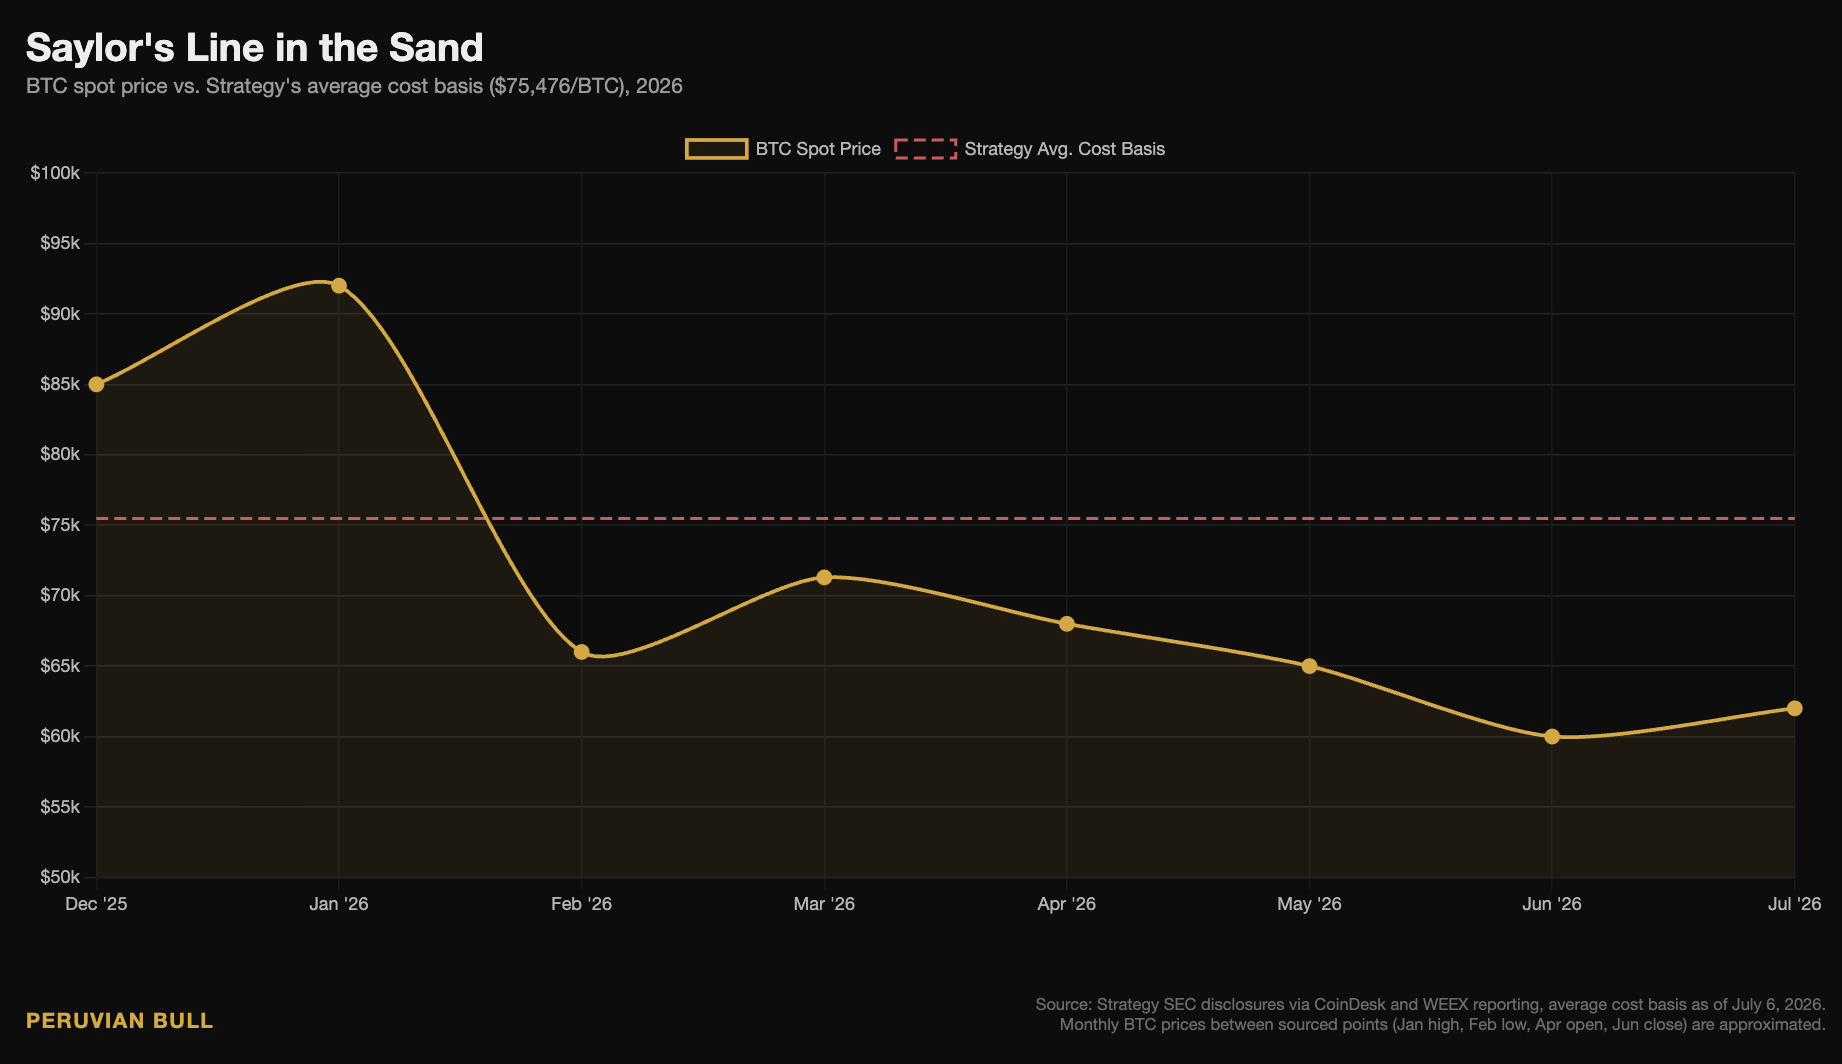
The flywheel that built Strategy’s stack needed MSTR shares trading above the value of the underlying Bitcoin, letting Saylor issue stock at a premium to buy more coin than the raise alone would fund. That premium is gone.
Preferred dividends now run roughly $1.7 billion a year, paid regardless of what Bitcoin does. Strategy has responded with a $3 billion cash reserve, 20.4 months of dividend coverage, and authorization to monetize up to 20,800 BTC if needed. Some analysts now warn of a further slide to $50,000 or even $20,000 if forced selling accelerates, and even Peter Schiff called the cash hoarding a needless destruction of shareholder value, which tells you how uncomfortable this has gotten even for people rooting for it to fail.
Strategy is not FTX. It’s not committing fraud, and its cash runway buys real time.
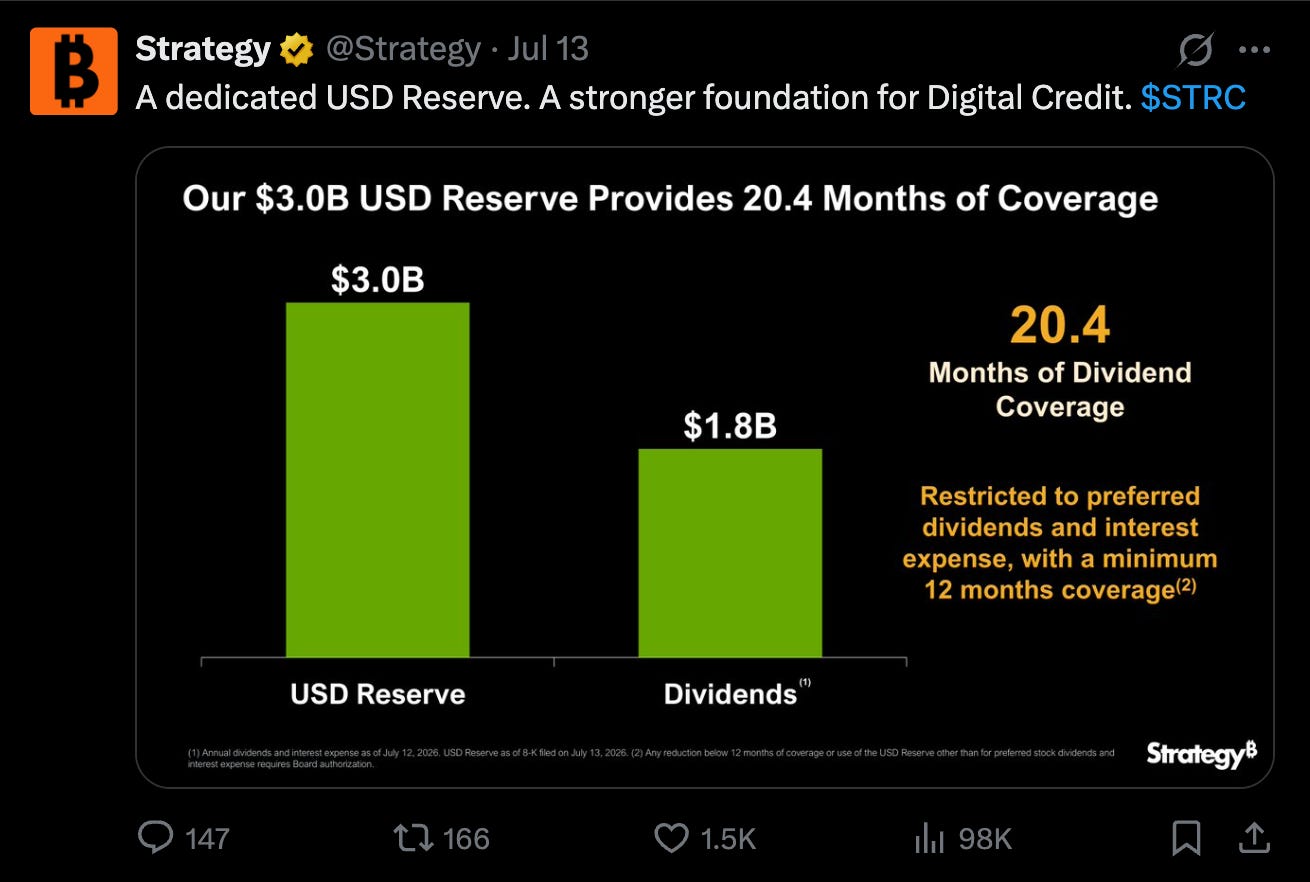
But it’s a large, leveraged, forced participant in a market already thin on natural buyers, and forced sellers with a two-year runway have a way of becoming forced sellers with a six-month runway if the asset keeps grinding lower. If Warsh’s “no bailouts, crypto included” line gets tested, this is where it gets tested.
The other structural pillar holding this market up, or failing to, is the ETF complex, and June was the worst month it’s had since the products launched in January 2024.
US spot Bitcoin ETFs posted $4.51 billion in net outflows in June, the largest monthly redemption since inception, led by BlackRock’s IBIT. That capped a rough stretch: the funds had already absorbed $6.38 billion in outflows between November 2025 and February 2026, before a genuine two-month recovery in March and April, $1.37 billion and $1.97 billion respectively, that briefly looked like the bottom was in. June erased that entirely, and digital assets closed a third consecutive quarterly loss, the longest losing streak since 2022, as institutional capital rotated into AI equities instead.
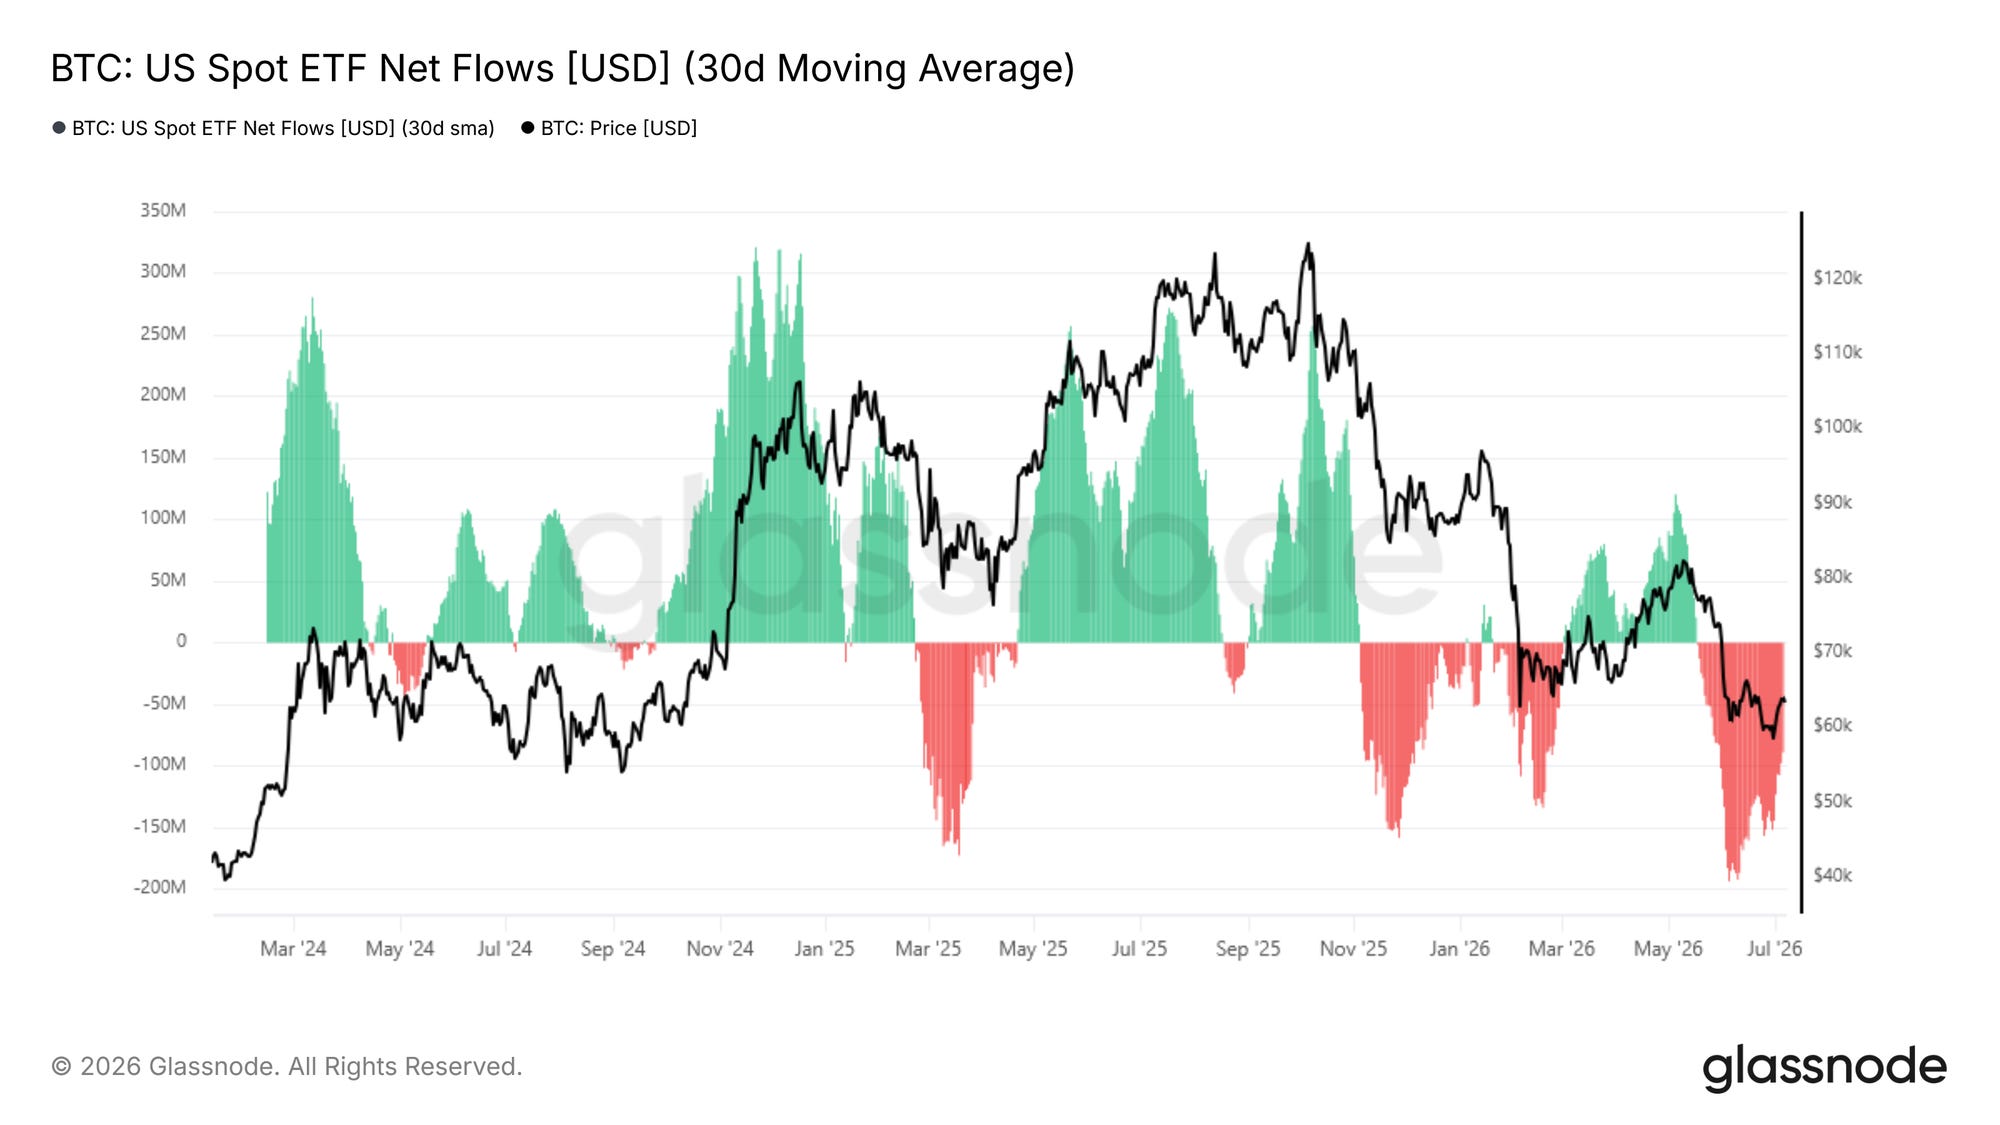
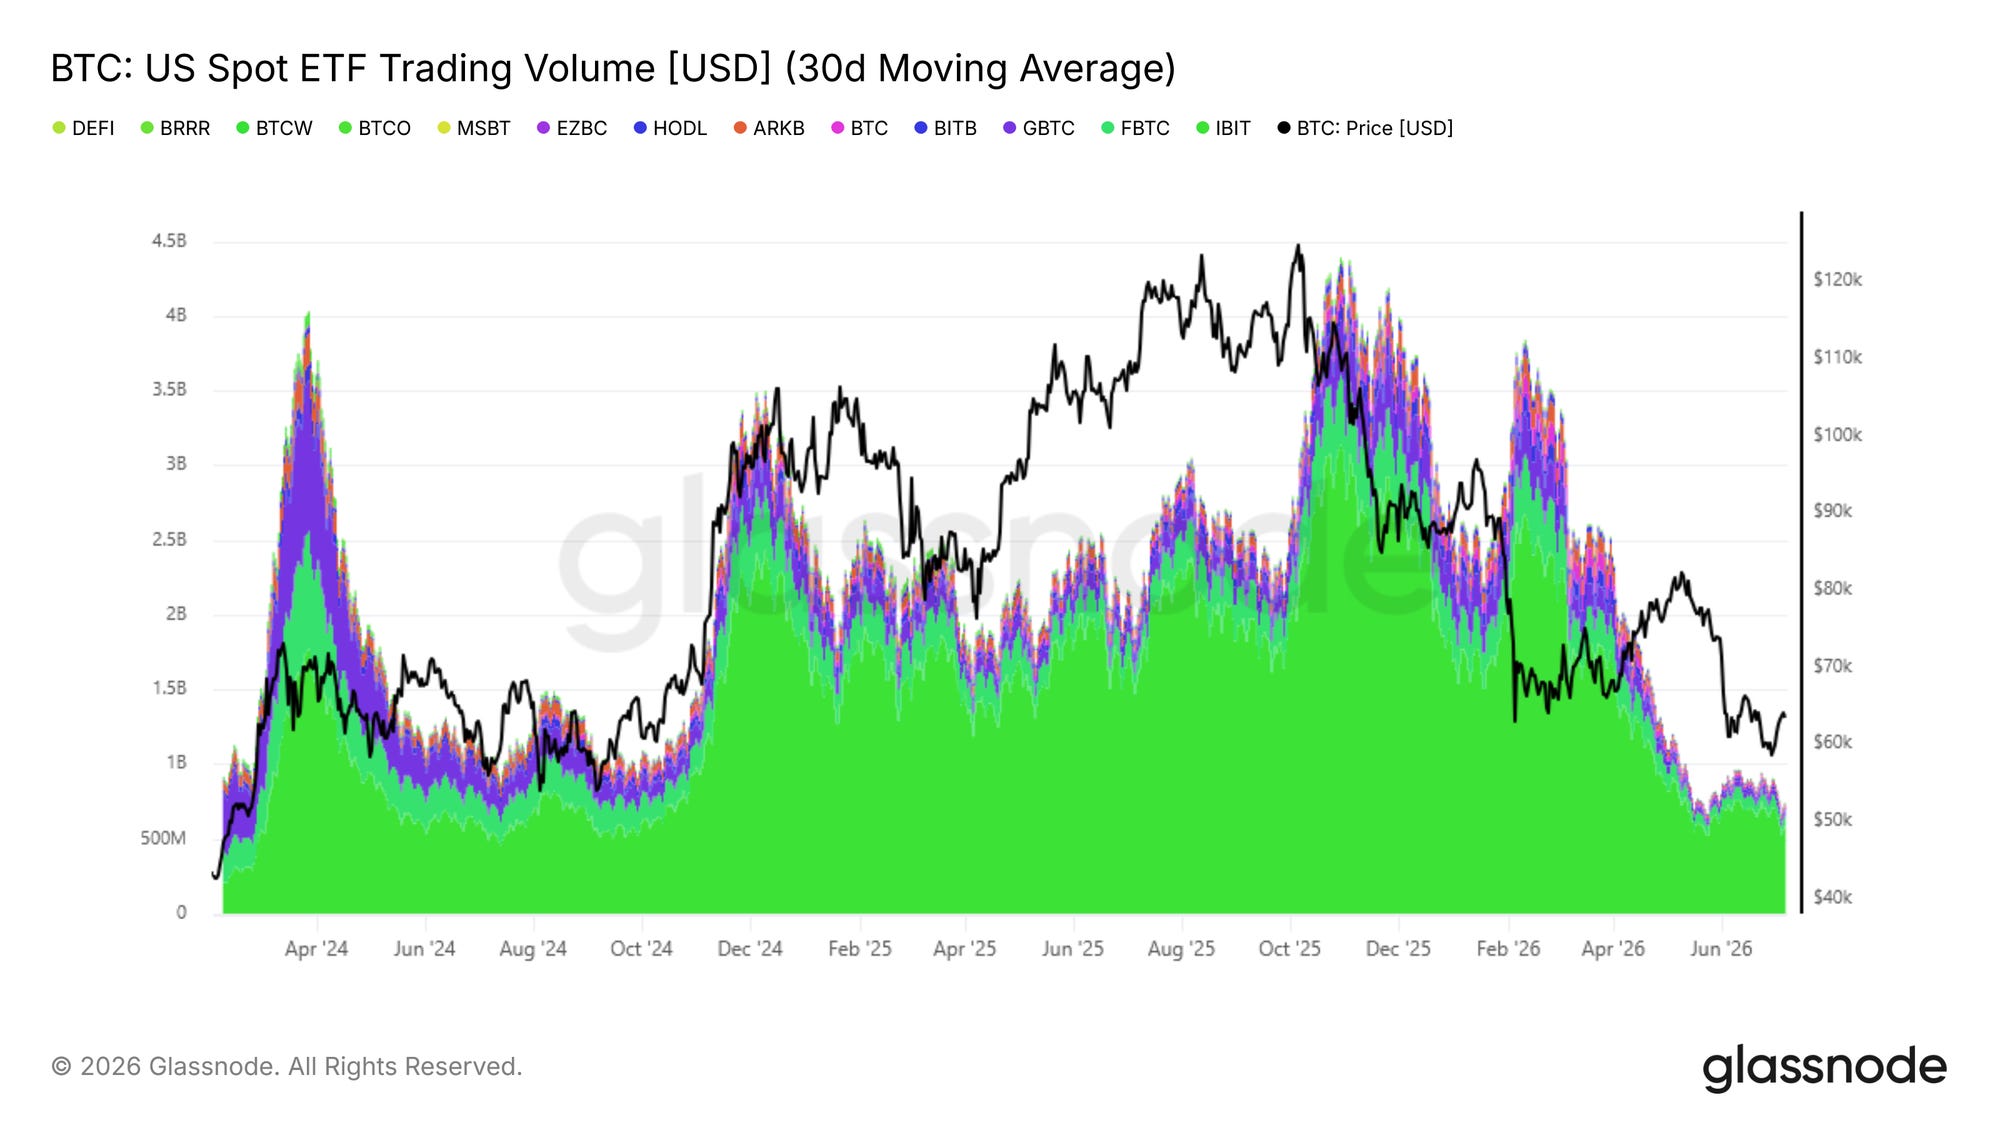
This matters more this cycle than in prior ones because the ETF bid replaced retail leverage as the market’s marginal buyer, and when it reverses, that floor becomes a headwind. The Fear and Greed Index printed 10 on February 5, its yearly low at the time, then 11 on July 1, an even lower reading than February despite a shallower price decline, which tells you sentiment is now leading price lower rather than confirming it. It’s since ticked up to the low twenties on a soft June jobs report, but that’s still deep extreme fear, nowhere near the euphoric 82 that accompanied the October top.
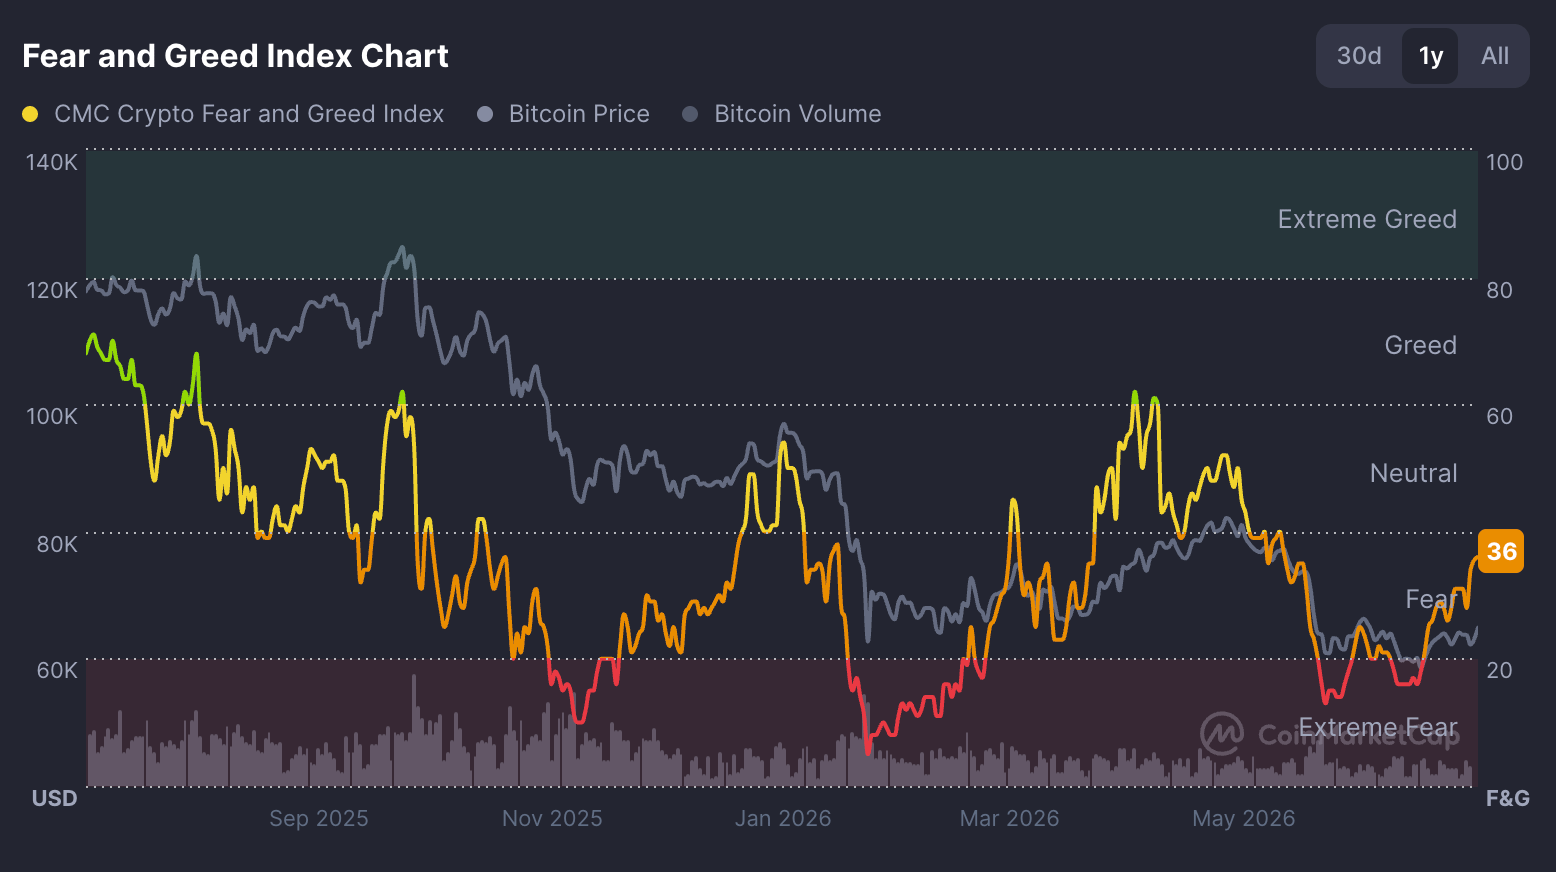
Extreme fear this persistent has historically flagged proximity to a low better than it flags a top, though it isn’t, alone, a timing tool. Open interest has collapsed from over $90 billion to about $44.5 billion since the peak, and CryptoQuant data shows whales accumulating more than 270,000 BTC over a two-week stretch in late June even as the ETFs bled.
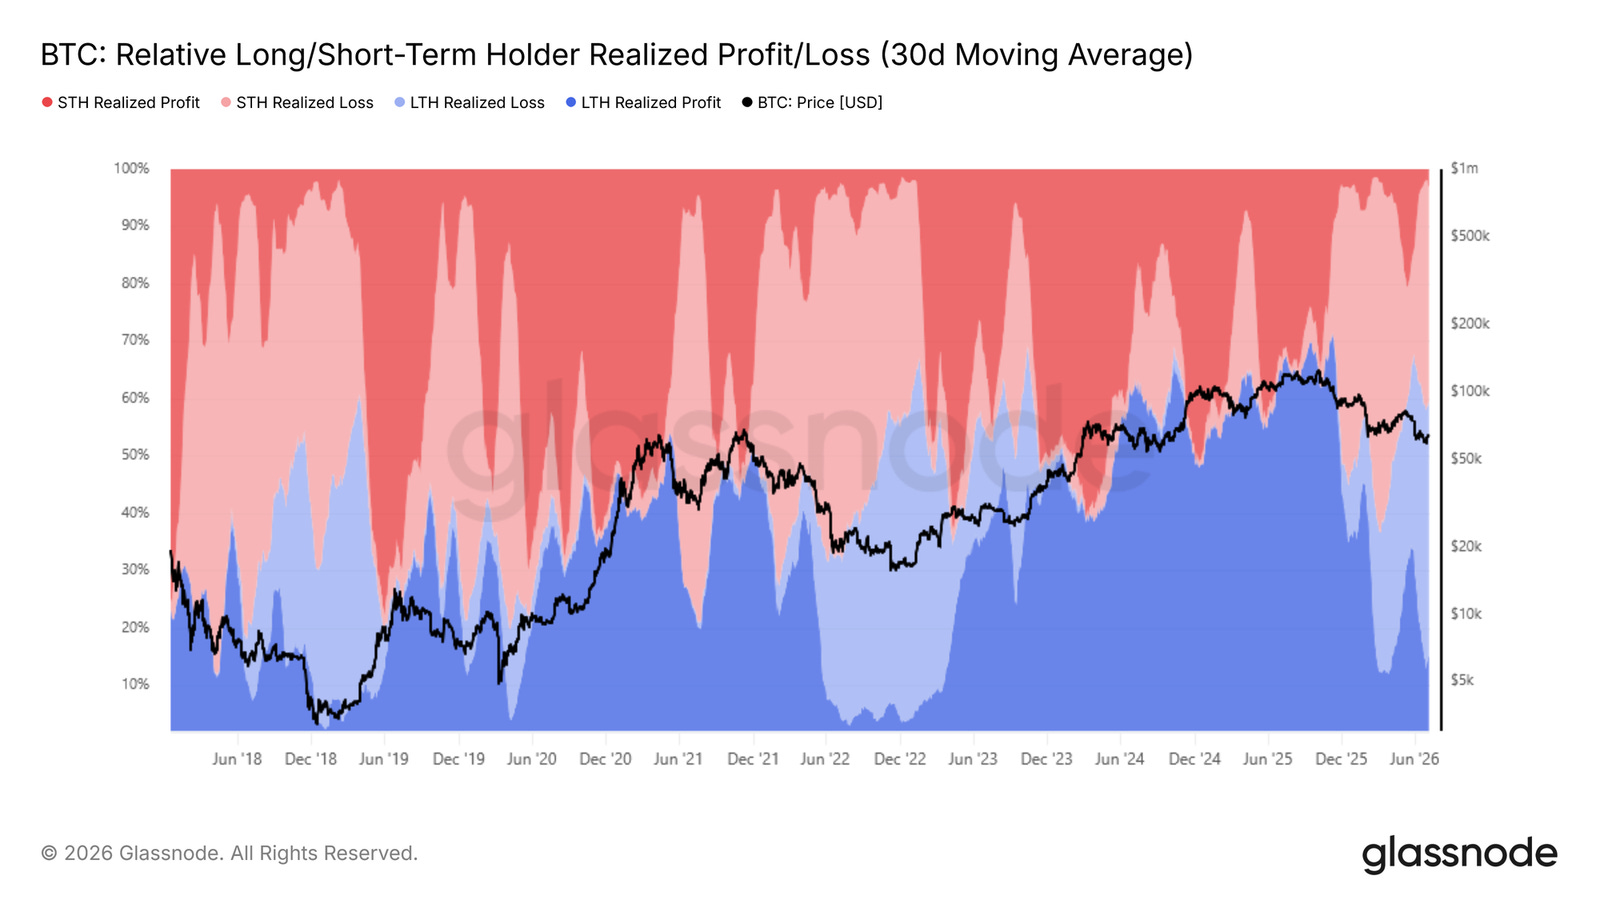
Every prior Bitcoin bear market ran roughly 55 to 65 weeks top to bottom, and applying that window to an October 6, 2025 top puts the statistically likely low around late November 2026. That lines up with the fundamentals: using the same 12-to-15-month peak-to-bottom timeline from 2018 and 2022, the on-chain data points to a bottom between October 2026 and January 2027, Q4 2026 most likely. CryptoQuant, Glassnode, Benjamin Cowen, and PlanB have all separately landed on roughly the same quarter, and December carries extra weight historically since the 2018 low printed near $3,200 in December and the 2022 low printed near $15,500 in November.
Veteran technician Peter Brandt, who correctly called both the 2018 bottom and this cycle’s October top while Bitcoin was still trading above $100,000, is looking for an “investable low” forming in September or October 2026, possibly undercutting the February low near $60,000 on the way there.
Multiple frameworks, none of them talking to each other, converging on the same three-month window and roughly the same price zone: I don’t put much faith in any single indicator here, but I put real weight in four or five unrelated ones agreeing.
The obvious objection, that ETF-driven ownership has structurally broken the four-year cycle, is worth taking seriously; I just haven’t seen the evidence yet, since every on-chain metric here is still following the old script almost to the decimal point.
Let’s assume the bottom forms in Q4 2026, in that high-$30,000s to low-$50,000s zone the drawdown trend points to.
Run the multiple-compression math from earlier in this piece against a realistic low and you land in Brandt’s neighborhood, not the six-figure moonshot targets some price-prediction sites are still running. A 2.5x to 3.5x gain off a $50,000 low puts the next cycle top between $125,000 and $175,000, closer to Standard Chartered’s current number than anyone’s old $500,000 fantasy. A genuinely favorable liquidity backdrop, Warsh delivering “QT-for-cuts,” the 2028 halving landing on a recovering ETF bid, could stretch that toward the $200,000 area Bernstein has floated for 2027. That’s still extraordinary. It’s not $500,000, and it’s definitely not the $1,000,000 numbers Saylor and Ark Invest’s Cathie Wood like to throw around for 2030.
None of this changes the long run thesis, and regular readers know I still think Bitcoin’s structural remonetization plays out over the coming decade as sovereign debt dynamics force capital toward every hard-supply asset it can find, gold included.
Four winters in, and the pattern hasn’t broken once: shallower crashes, smaller multiples, a market getting slower and heavier as it grows up.
You’re thinking the next cycle top is between 125k and 175k? And a liquidity pump from the Fed could push it closer to 200k??
Good piece.
Retail comes for the upside but institutions stay for the downside protection!